
Read the latest issue of Dairy Market Drivers, a bi-weekly report from IDFA partner Ever.Ag. Dairy Market Drivers features spotlight data, key policy updates, and a one-minute video that covers timely topics for the dairy industry.
Dairy Market Drivers: Retail Fourth Quarter Performance; Fluid Milk Update; and U.S. Dairy Exports in a Minute!
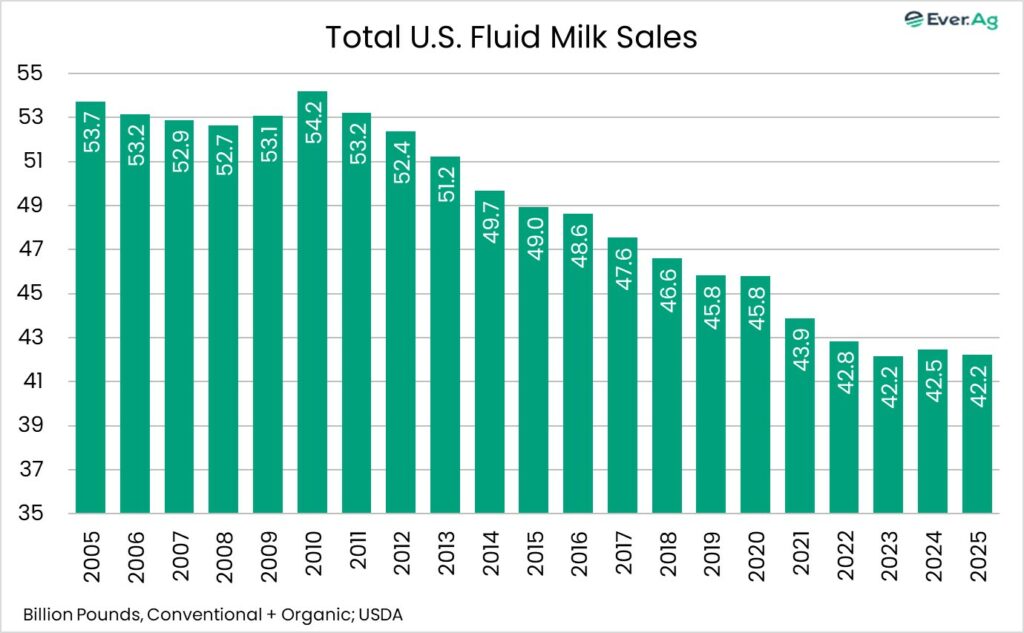
Quick Bites: Fluid Milk Sales Slide Again
- After a slight year-over-year uptick in 2024, fluid milk sales retreated again last year. According to USDA, conventional and organic sales volume reached 42.2 billion pounds in 2025, down 0.6% from a year earlier and continuing a decades-long trend. Twenty years ago, fluid milk sales totaled almost 54 billion pounds.
- Consumers’ fluid milk choices reflect the value of healthy dairy fats. Whole milk’s share of sales continues to grow, reaching 37% last year – up from 28% a decade ago. Reduced-fat, low-fat and non-fat varieties are heading the other direction, each losing about 5% of market share since 2015. Flavored and organic milk held steady last year with 9% and 7% market share, respectively.
- Fluid milk sales represented 18.2% of all U.S. milk production in 2025, down from 18.8% in 2024. Back in 2005, fluid milk sales utilized 30.5% of the nation’s milk output.
- With less milk going into fluid sales, more milk is available for other dairy products. The extra 260 million pounds of milk that didn’t go into fluid sales in 2025 versus the year before was enough to make about 575 additional truckloads of cheese last year.
Today’s Special
- Value wasn’t just a theme in 2025’s fourth quarter – it was the driving principle behind where consumers chose to shop and dine. In the retail space, Walmart posted 4.6% same-store sales growth in Q4, fueled by more purchases by higher-income shoppers seeking the convenience of fast delivery options and lower prices. This underscores how value-driven behavior now cuts across income levels.
- Traffic patterns tell a similar story, as Placer.ai data showed Walmart visits up 3.8% year-over-year in January, outperforming Target. Meanwhile, Kroger traffic rose 4.0%, and Dollar General traffic climbed 4.9%. Consumers continue to gravitate toward retailers that help stretch food dollars even as inflation pressures ease slightly.
- That same mindset followed consumers into restaurants. McDonald’s reported global comparable sales growth of 3.4% in Q4, including U.S. comparables up 4.3%. Value meals and promotions resonated with diners balancing convenience with tighter budgets. But not all burger chains fared equally. Burger King posted more modest momentum, with U.S. comparable sales up only 1.5% on the year.
- The pizza category revealed an even sharper divide. Domino’s generated approximately 2.8% sales growth, supported by multiple sales promotions, digital ordering and loyalty engagement. Meanwhile, Pizza Hut and Papa John’s faced softer demand that contributed to the announcement of store closures and restructuring efforts amid intense price competition.
- Consumers are still spending, but they appear more lasered into deals and affordable pricing. Across both retail and restaurants, operators winning traffic are those delivering clear value, convenience and consistency, while brands lacking those advantages are underperforming.